)
We take company spending seriously here at Spendesk. We're in the middle of massive changes to the way that businesses handle expenses, payroll, and money in general.
Automation and new payment methods are taking over, so stay tuned.
But in this post, we want to take stock of business spend as it stands today. How do companies really spend their money? We've put together nearly 100 statistics that will definitely get your attention.
As is customary, here’s an amazing stat that didn’t make the cut below: 82% of businesses fail because of cash flow issues. It makes sense - no cash means you can’t pay people or buy stock.
But fascinating, nonetheless.
Now let's dive into 100+ more interesting, insightful, and incredible statistics related to company spending.

Coronavirus' impact on business spending
Most of the statistics in this post deal with the reality before (or regardless of) the COVID-19 pandemic and economic fallout in 2020. This international crisis impacted company spending in what felt like unprecedented ways. At the very least, CFOs and finance teams haven't dealt with comparable circumstances since the Global Financial Crisis in 2008.
So before looking at overall spend trends and longer trend lines, let's quickly examine the immediate impact caused by the pandemic.
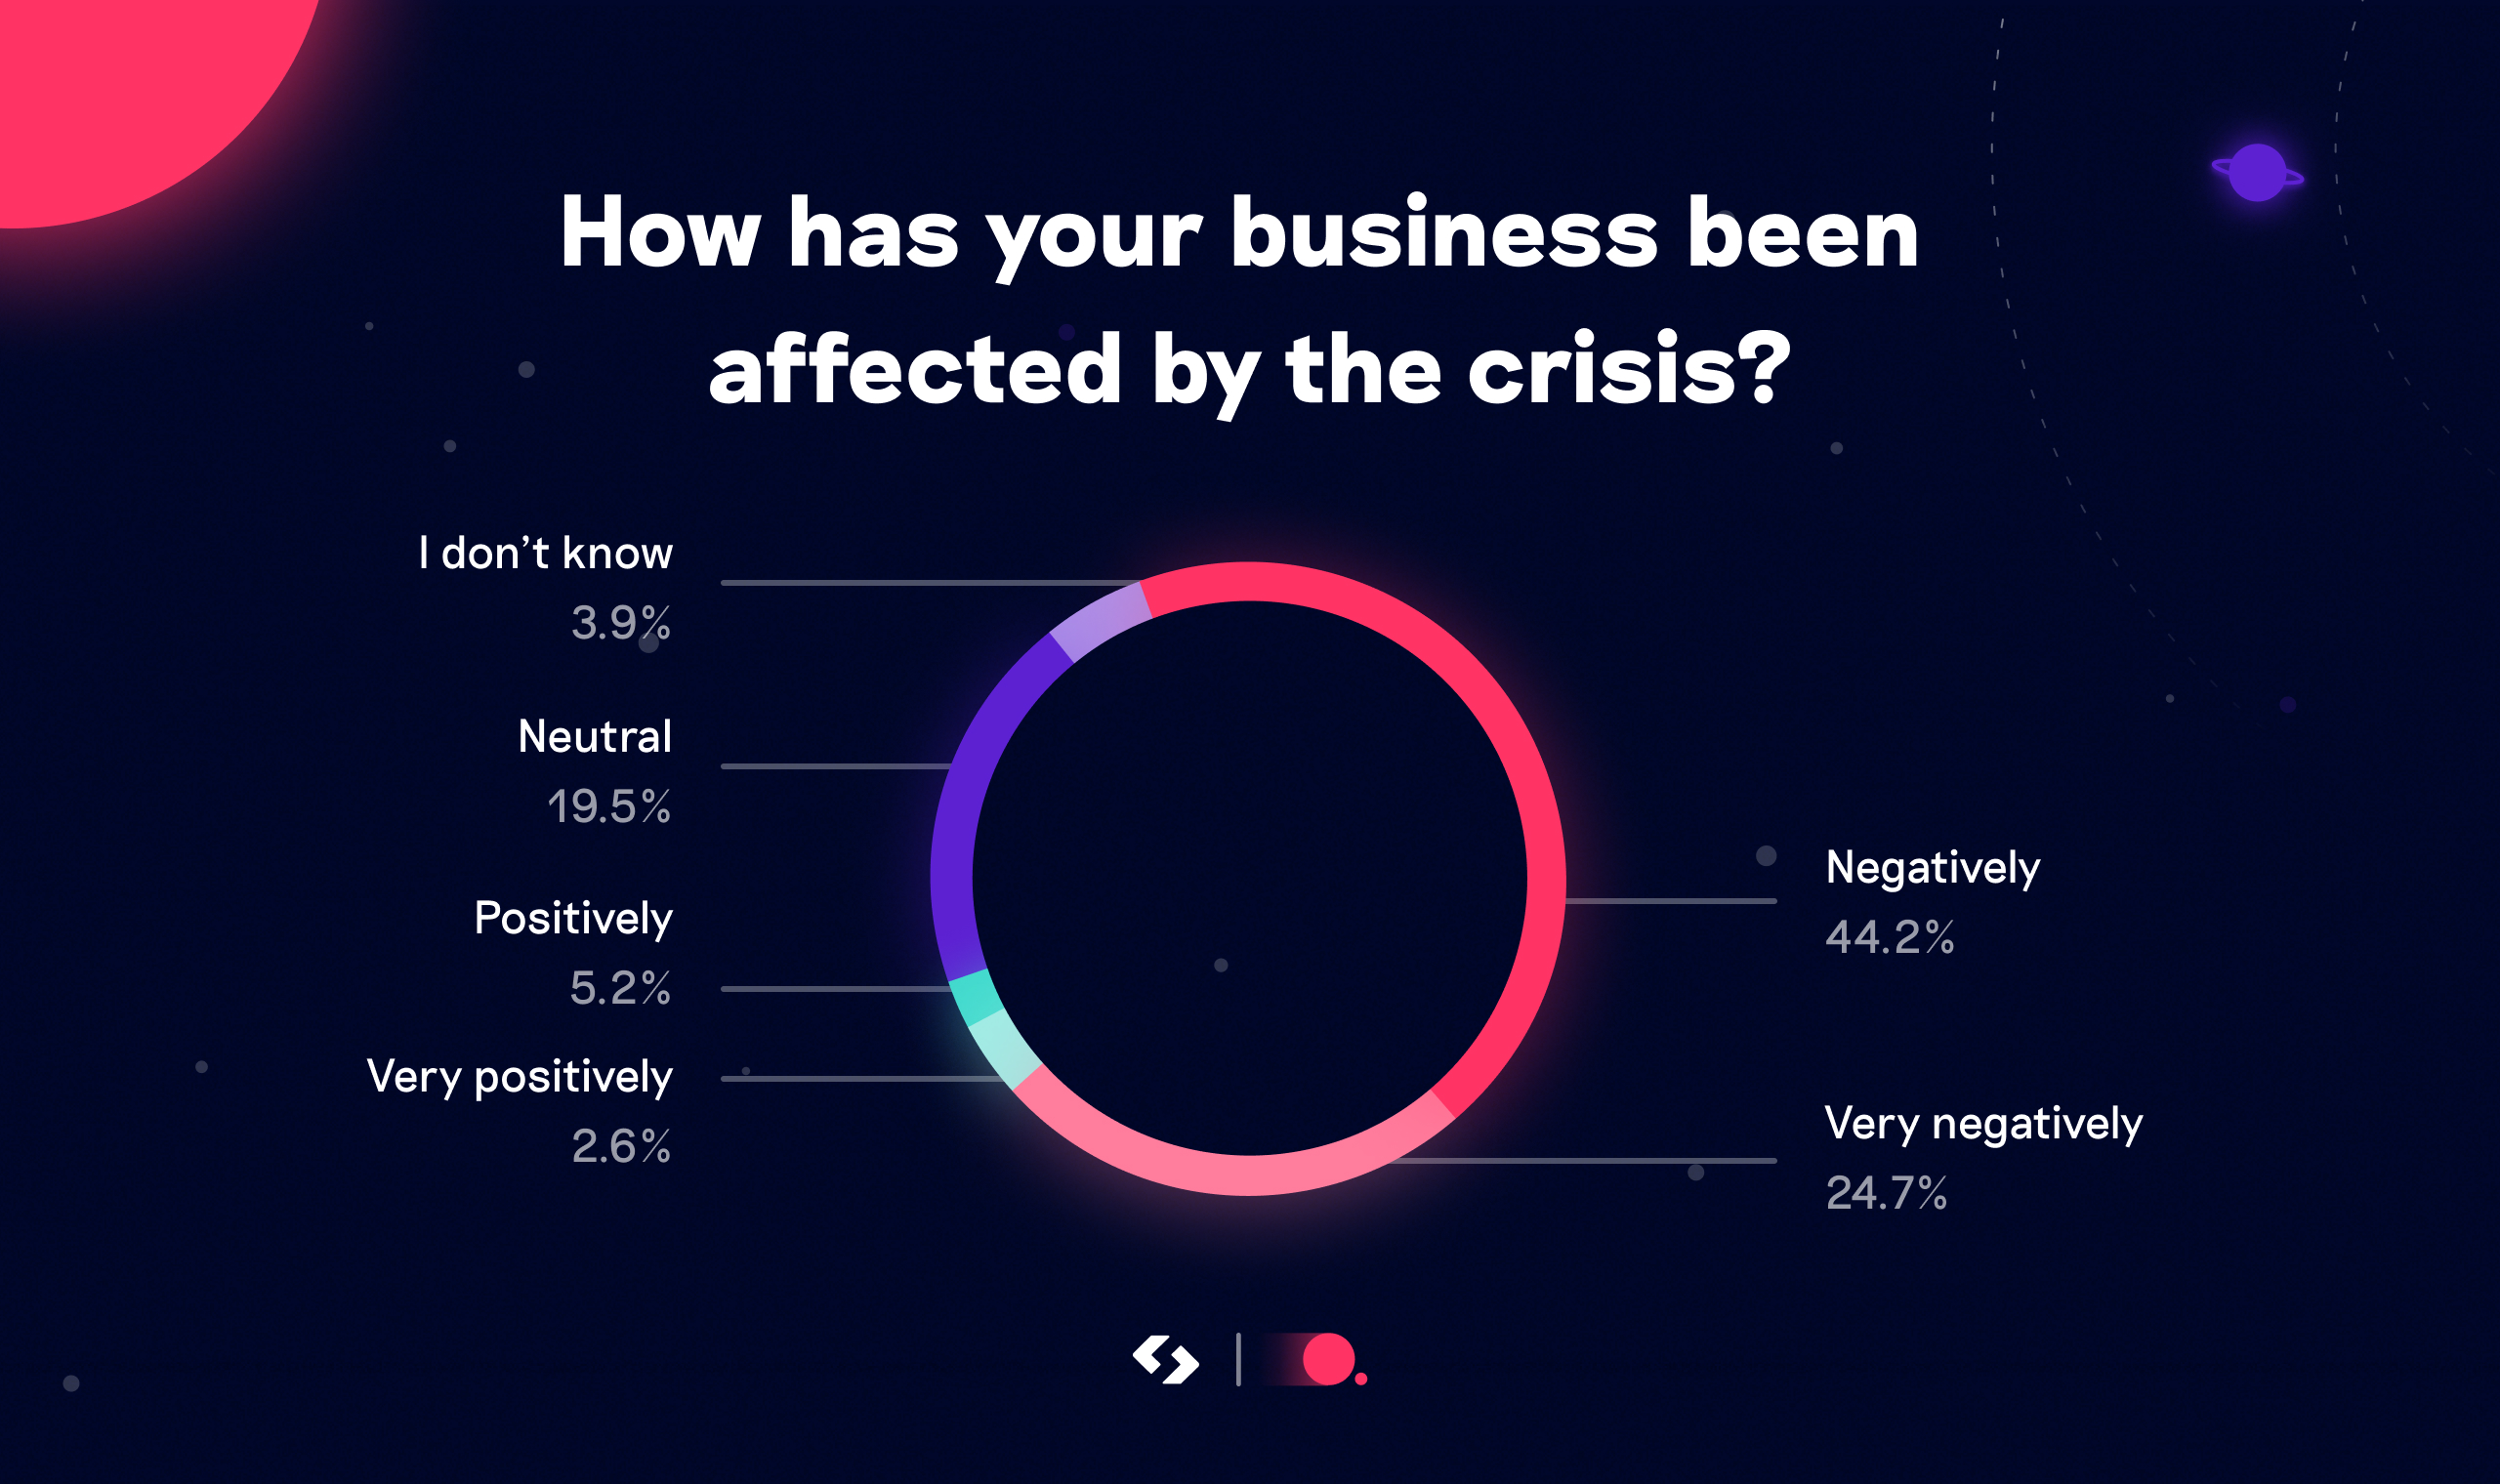
68.9% of respondents in one study felt that their companies were affected either negatively or very negatively by the crisis. (CFO Connect / Spendesk)
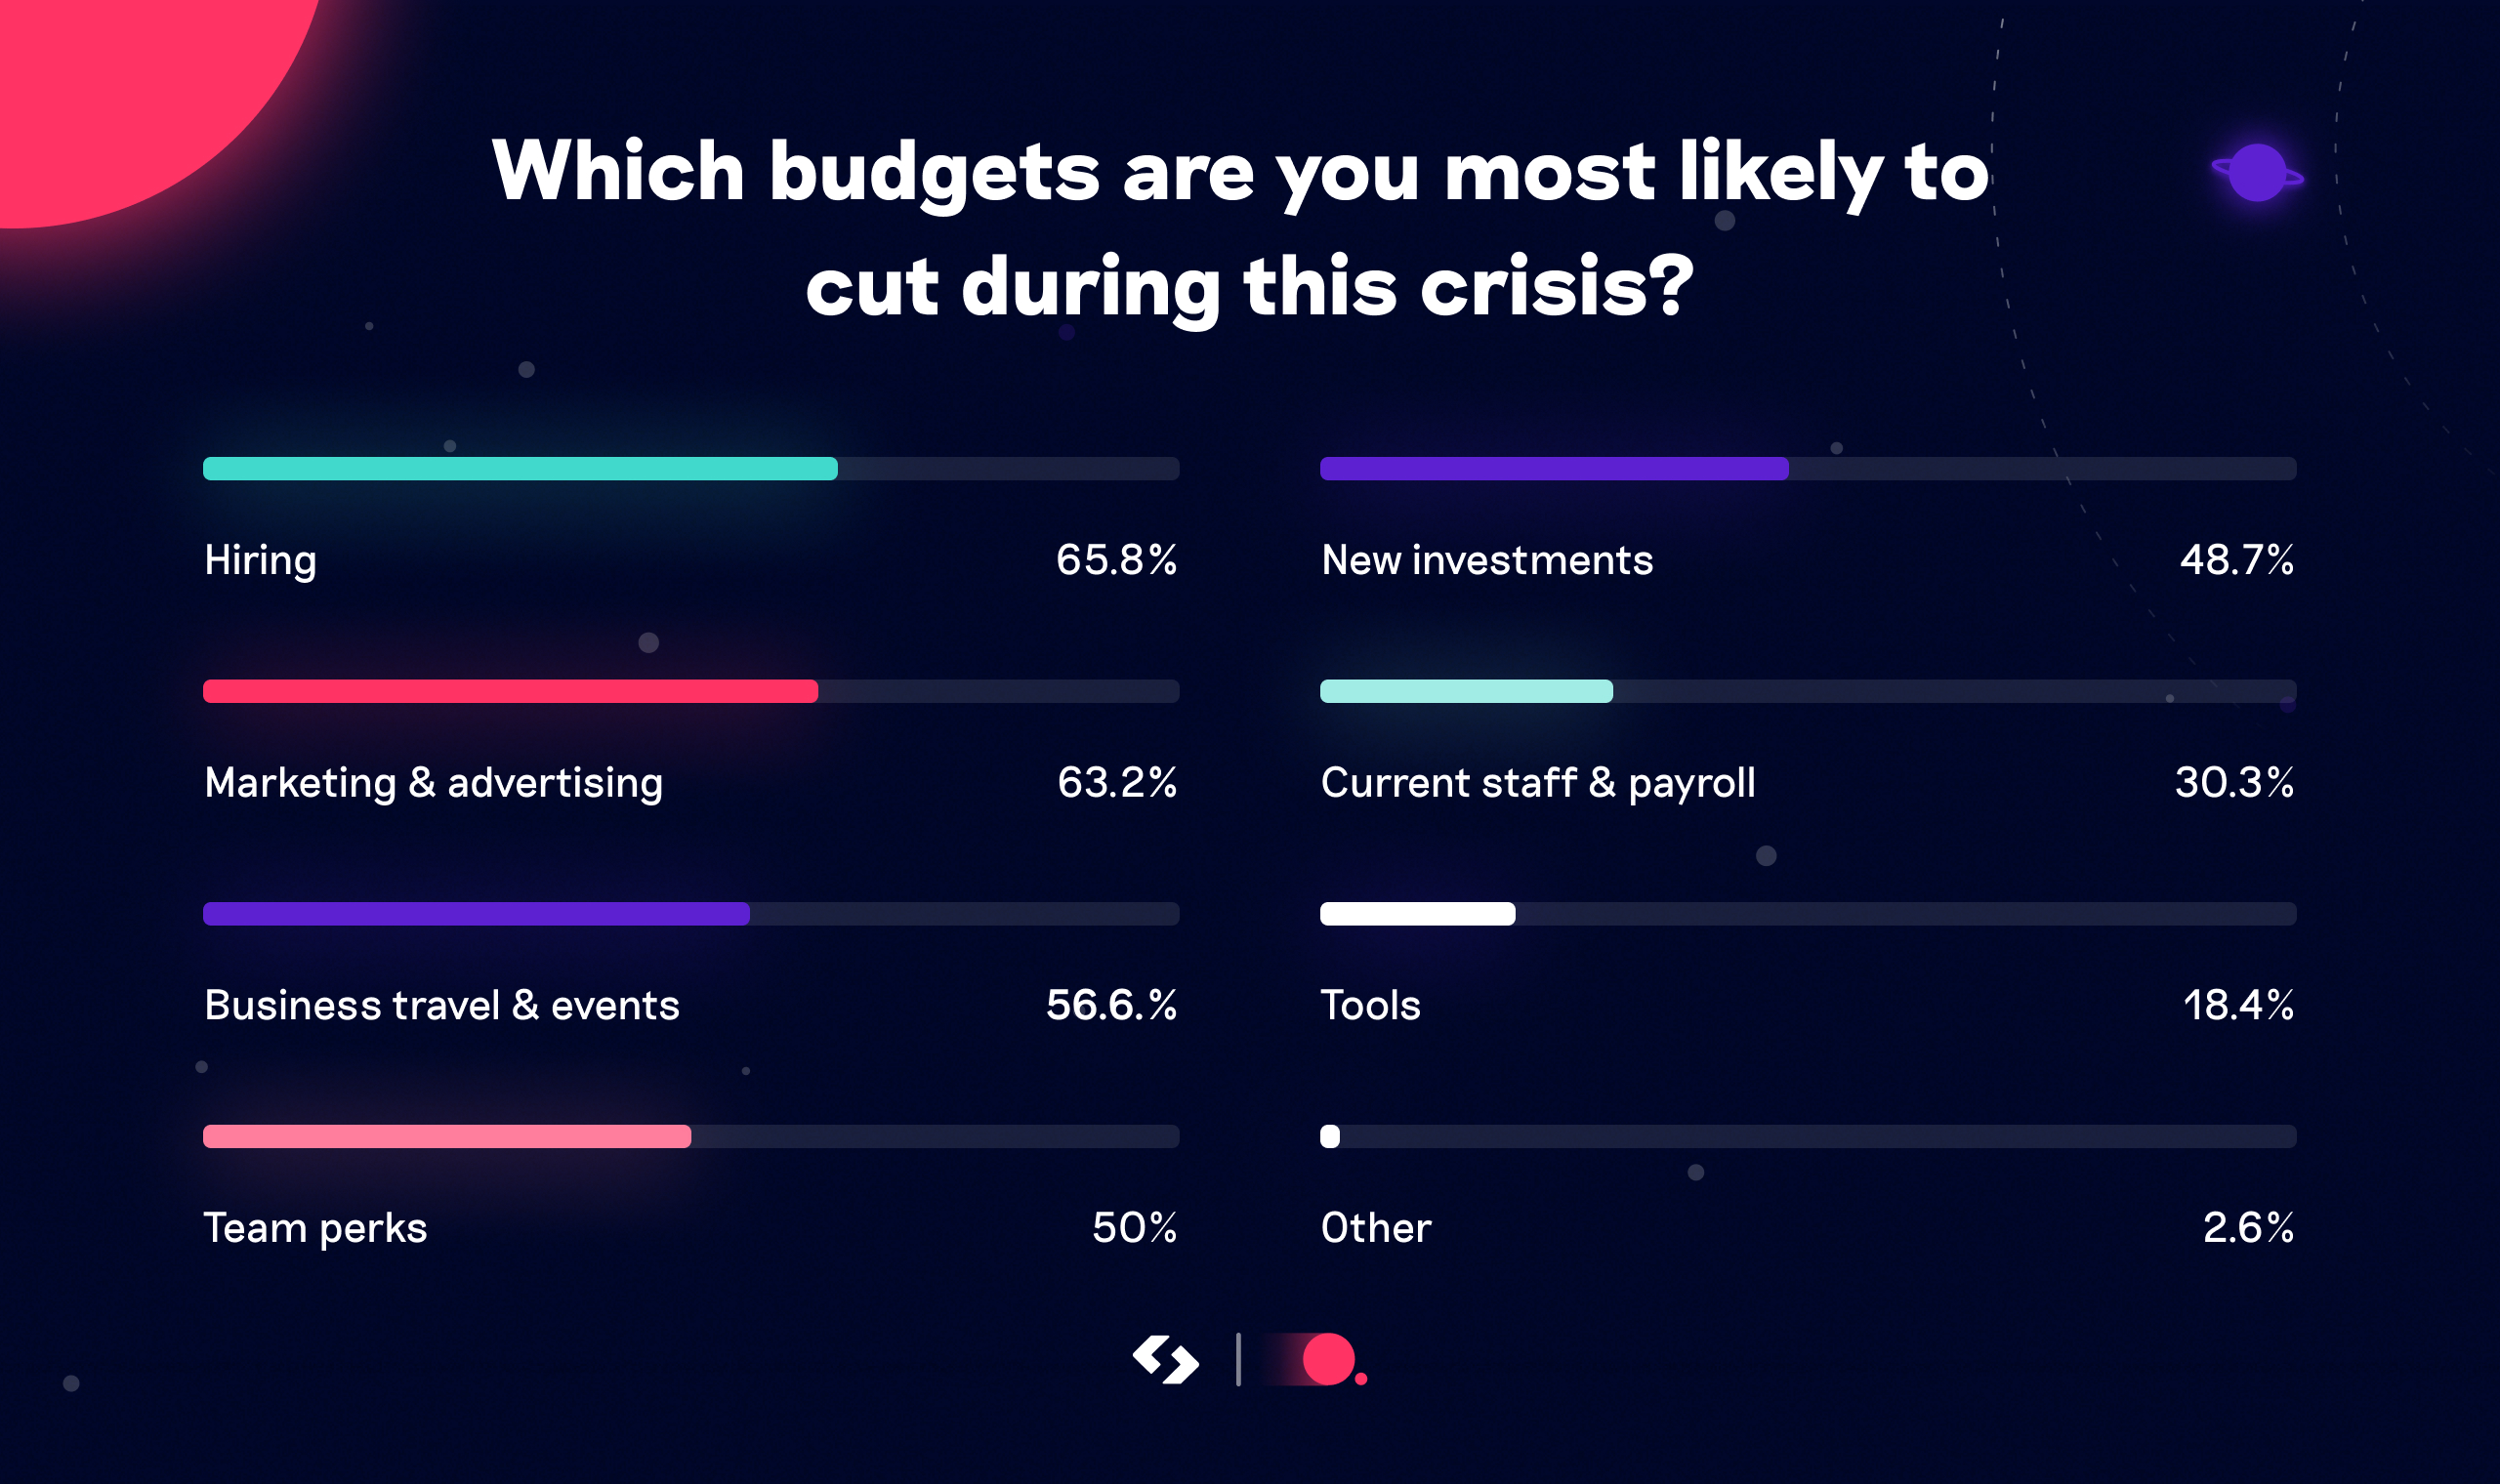
Naturally, this extends to spending. Among those surveyed, hiring, marketing & advertising, and business travel & events were identified as the most likely budget cuts. (CFO Connect / Spendesk)
Decreases in business spending
69% of companies were expected to decrease ad spend in 2020. (Influencer Marketing Hub)
Ad spends were down 9% on average across Europe, with Germany and France falling by 7% and 12% respectively. (World Economic Forum)
Google's ad revenue declined by more than 5%, the first drop in the company's 16-year history. (Fortune)
Facebook reported lower than forecast growth in the second quarter of 2020, perhaps more as a result of an advertiser boycott than the virus itself. Its share price continued to rise, however. (eMarketer)
The business travel industry expected to revenue losses of $810 billion worldwide due to the coronavirus. (Statista)
European IT spending (including software, hardware, and IT services) was expected to decline 4.7% in 2020 to reach $487 billion. (IDC)
New emphases for growth
The virus changed the very nature of doing business for many companies.
Most business categories saw more than 10% growth in their online customer base. (McKinsey) This focuses on private consumers, but naturally business spending has followed suit.
10% of businesses began using chatbots and web-based customer communications as a result of the crisis. (McKinsey)
21% of companies reported using face-to-face meetings with customers as a go-to-market strategy, down from 55% before the crisis. (McKinsey)
Early indications show just how a profound an impact COVID-19 has had on how business is done. This impact is likely to be felt for years to come.
Let's look now at dozens of key company spending statistics, most of which were gathered before the virus arrived.
Payroll statistics
Here’s a fun one to kick off this section: One third of all sick days take place on Mondays. That doesn’t have a whole lot to do with spending, but it’s certainly suspicious.
Payroll costs - specifically human labor - are usually the largest expenses for a business. People can easily account for 70% of your company’s spending.
So what does the average employee cost these days?
Salary statistics
For most companies, salaries are the largest expense. And naturally the amount in question depends largely on your industry and location.
The average full-time salary in the United Kingdom is £35,423 per year. (findcourses.co.uk)
36% of full-time British employees say a pay decrease or pay freeze (adjusted for inflation) in 2019. (ons.gov.uk)
And Londoners make on average £10,000 more per year than those living in other cities. (City A.M.)
The average British account manager (sales) earns £52,500, PR pros make £37,799, marketing associates £34,180, and HR officers £31,994. (findcourses.co.uk)
Notably, the gender pay gap for full-time UK employees is 8.9% (as of 2019). This has only dropped 0.6% since 2012. (ons.gov.uk)
The average full-time salary in Paris (France) is €48,717. Software engineers can expect to be paid €42,043, financial controllers €47,500, and business development managers €55,622. (PayScale.com)
The average salary in Germany is €46,560 per year, full-time. Specific industry averages are considerably higher, with banking and finance professionals averaging €83,371, IT workers on €72,582, and engineers making €71,134 per year. (Expatica.com)
As of Q1 2020, the median salary in the United States was $957 per week or $49,764 per year. (The Balance Careers)
In the U.S., physicians have the highest annual salary, followed by pharmacy managers and pharmacists. (Glassdoor)
Other sites report that employees in "professional, management, and related occupations earned the highest pay." (The Balance Careers)
Aside from salaries, managing payroll comes with other, less obvious costs. The time and effort it takes each month to ensure that everyone is paid can really add up.
Payroll management statistics
17% of small businesses commit 6-10 hours per month on payroll, while 11% spend more than 10 hours every month. (Score.org)
54% of the American working population - 82 million people - are impacted by payroll problems. (Zenefits)
In one study, 20% of employers rely on spreadsheets to manage attendance, as opposed to more advanced modern tools. (Workforce Software)
Only 39% of organizations use a cloud-based payroll system. (Deloitte)
And here’s an extraordinary statistic for companies considering modernizing their payroll tools:
Automation helps businesses reduce payroll costs by up to 80%. (American Payroll Association)
But only 6% of companies in one survey stated they already use process automation in their payroll processes. (Deloitte)
Clearly, the more you can let the machines take care of menial tasks, the less you need to rely on people to get them done. And that means more room for people who add real value to your business.
Not just that, but automation tends to be a lot more accurate. And as it turns out, people make a lot of mistakes:
Somewhere between 1-8% of paper-based payroll entries (time cards) contain errors. (American Payroll Association)
And those little errors add up:
35% of an average HR team’s time is dedicated to payroll and error correction. (OnePoint HCM)
Reportedly, managing payroll manually leads to 100 human hours per year for every 25 full-time employees you have. (OnePoint HCM)
This is why payroll management software is expected to grow by 9% over the next six years. (Industry Reports)
Office expenses statistics and team perks
On more of a day-to-day basis, companies also need to spend on items and services to keep employees happy in the office. At the small end, this can include drinks and snacks on a Friday evening.
But as employees start to get used to more elaborate perks, the importance of these grows for business owners.
80% of workers would rather stay in a job with benefits than take one that offered more pay but no benefits. (American Institute of CPAs)
Rather than snacks and yoga classes, more Americans feel that contributions to pensions (401(k)), health insurance, and paid time off are the most enticing perks. (American Institute of CPAs)
In one survey, 77% of respondents said the opportunity to telecommute sometimes would make them more likely to sign a job offer. (Robert Half)
86% of U.S. employers give financial incentives to employees who participate in well-being programs, with an average incentive of US$784. (Fidelity Investments)
Employers increased spending on training in 2017, up nearly 2% to $1,296 per employee. (ATD)
Eventbrite offers employees an US$80 wellness stipend, Microsoft hands out an $800 “StayFit” reimbursement to employees each year, and Airbnb gives employees $2,000 per year for travel. (Compt)
Many of these offers are beginning to move from “team perks” to becoming almost essential. Especially if companies want to attract the best talent available.
Taxes, legal fees, and startup costs
Another big worry for most businesses is the amount of taxes they’ll have to pay each year. This is closely tied to the company’s overall spending, and filing administrative expenses often takes up a lot of time.
Legal fees are another cost that every business hopes to keep low, but which inevitably blossoms when you least expect. And of course, this can go hand-in-hand with taxes - especially if your books have not been handled well.
The average British startup spends £22,756 in its first year on set-up and administrative costs. This doesn’t include payroll, product development, or marketing costs. (The Telegraph)
The above figure includes £6,259 for legal fees, £3,937 for accountancy, and £5,518 for company registration and other such costs. (The Telegraph)
One in three small businesses reports spending more than 80 hours per year on federal taxes, which include payroll. (Wagepoint)
And another ⅓ of small businesses is punished by the IRS each year for payroll mistakes, at an average penalty of US$875. (Zenefits)
According to the U.S. Small Business Administration, most small businesses cost $2,000 to $5,000 to launch. (Business News Daily)
This obviously depends largely on the nature of the business. "You can operate a website for less than $100 a month, while operating a restaurant is more likely to cost at least $10,000 a month." (Value Penguin)
40% of small business owners state that bookkeeping and taxes are the worst part of owning their business. (Score)
28% of small businesses report spending more than US$10,000 per year on taxes, legal fees, and associated costs. (Score)
While hopefully this isn’t something you’ll have to worry too much about, legal fees and taxes can be a significant burden on many companies. And it can pay to plan ahead.
Marketing and advertising spend statistics
For many modern businesses, growth is the biggest challenge. And in order to spur this growth and build brand awareness, companies dedicate significant sums to marketing and advertising.
In fact, marketing budgets equal 11.2% of company revenue on average, and have been mostly steady in recent years. (Gartner)
Gartner also found that nearly one third of marketing budgets (29%) is spent on tools and technology. This number is now higher than marketing labour costs:

Image: Gartner
Let’s turn our attention now to some specific aspects of marketing common in many modern companies.
Content marketing costs
Content marketing is an incredibly popular tool to generate interest in a brand’s products and services. Using blogs, video, and social media, marketers dangle enticing content in front of potential buyers, and let customers come to them.
And this approach is undoubtedly growing.
Content marketing was expected to account for more than US$300 billion in revenue in 2019. (Statista)
Another projection found that the amount spent on content marketing was is expected to surpass €2.12 billion in 2020, in Europe alone. (Statista)
In one survey, 93% of the most successful B2B companies were very or extremely committed to content marketing. (Content Marketing Institue)
24% of marketers expected to increase their investment in content marketing in 2020. (HubSpot)
The same study found that 77% of the most successful businesses rely on buyer personas for content marketing, compared with only 36% of the least successful. (Content Marketing Institute)
In 2018, 71% of B2B customers said they read blog content before buying. (Demand Gen)
Digital advertising spending
Thanks to now-essential marketing channels like search and social media, digital advertising is perhaps the fastest-growing technique in the marketing world. And it’s no flash in the pan - companies are committed to spending large sums on paid search and social.
Global spending on paid digital marketing was estimated to be around US$100 billion in 2018. (Reuters)
Businesses spend on average 21% of marketing budgets on advertising, with two-thirds of that advertising money now spent online. (Gartner)
Paid search advertising spend is growing 10% year-over-year. But click-through rates have fallen overall. (Search Engine Journal)
In fact, digital advertising is now worth US$30 billion more per year than television advertising. (Brafton)
Nearly 20% of all advertising spend worldwide goes to search platforms. Google obviously dominates this field, and this doesn’t even include paid social. (B&T)
In Europe, companies spend the most on Google ads, followed closely by Facebook and then LinkedIn. (Spendesk)
From our own Spend Trends report, the above three companies are also among the 10 most expensed vendors for business costs overall. In fact, our study found that after Amazon, companies spend more on Google and Facebook (respectively) than any other suppliers. (Spendesk)
In the United States, 38.6% of digital ad spend goes to Google, and Facebook ads budgets much up 19.9%. Between them, these two companies account for more than half of all online advertising money. (Wordstream)
One often overlooked advertising platform: Amazon reported over US$10 billion in ad revenue in 2018, up 95% from the year before. (Geekwire) Amazon is already the most-expensed vendor for European businesses, and this shows no signs of slowing down.
Google’s chief economist estimates that businesses make $2 for every $1 they spend on Google ads. (Google)
The average cost-per-click on Google’s search network is US$2.69, while that number is only $0.63 on the display network (on-site advertisements). Interestingly, the legal industry has the highest average cost-per-click at $6.75 for search ads. (Wordstream)
U.S. companies spent more than US$13.23 billion on digital video ads in 2017, and that number is expected to exceed $22 billion by 2021. (eMarketer)
Retail is the industry with the highest video ad spend. (Statista)
18% of total Facebook spend went to Instagram, with 34% of that Instagram spend on Instagram Stories. (Search Engine Journal)
Clearly digital advertising is an enormous and still-growing market. But this doesn’t mean that non-digital marketing is dead in the water.
Event costs
With the advertising and content marketing spheres feeling flooded, many businesses are turning to in-person meetings and trade shows to put a face to their products.
In 2017, global spending on business events reached more than US$1.07 trillion USD. (Events Industry Council)
The average event attendee spends US$704 for each event. (Events Industry Council)
The median amount spent by businesses to sponsor an event is US$20,000. (MarketingCharts)
The success and scale of global business events has directly created 26 million jobs. (Events Industry Council)
As mentioned above, businesses are working hard to grow. Whether that means more digital ads, investing in content, or attending events, marketing budgets are a major factor for most companies.
Business travel stats
We previously wrote a deep dive on business travel statistics. Here are the highlights from that piece:
Companies spent US$1.33 trillion on global business travel in 2017. (Statista)
That number is expected to reach US$1.7 trillion by 2022. (Statista)
Americans spent US$317.2 billion on business travel in 2017, compared with US$718.4 billion for leisure travel. (U.S. Travel Association)
57% of work travelers would prefer to book with a single app or tool. (Booking)
30% of those who fly for business do so every single month. But 62% of flyers only take wing once a year. (Fly Aeolus)
North American companies expensed more Uber trips than payments to any other company. (Business Traveller)
Meanwhile French and British companies now take twice as many Uber rides as taxi trips. (Spendesk)
To learn more about how companies spend on travel, download our new Spend Trends Report:

Tools and subscription expenses
Another trend that shows no signs of slowing down is the growing reliance on SaaS (software as a service) tools. These platforms give companies top-quality solutions for everything from CRMs to spend management, without having to build them themselves.
This is usually more convenient, faster, and more affordable overall than the alternative. No wonder they’re so popular.
Annual SaaS spending worldwide is expected to surpass US$85 billion by the end of 2019. (ZDNet)
The average company changes its subscription stack by 43% every year. (GlobalDots)
The average company spends US$343,000 per year on SaaS tools. (Blissfully)
Spending on marketing automation tools is projected to exceed US$25 billion by 2023. This will grow from US$11.4 billion in 2017. (Forrester)
55% of CMOs plan to increase spending on marketing technology in the next year. (Marketing Dive)
Artificial intelligence is likely to grow even further, hitting more than US$52 billion in 2021. (Marketing Dive)
In the past, companies would host their own customer relationship management (CRM) tools in-house. In 2019, 75% of CRM software spend goes to cloud-based technology, usually on a subscription basis. (Gartner)
Cloud-based sales CRMs now account for 84% of spending on sales CRM deployment. (Gartner)
SaaS tools are deployed by virtually every business team, led particularly by engineering and sales:

Image source: Blissfully
The “SaaS revolution” is in full swing, and this market only promises to grow further.
Research and development costs
Another interesting area for large businesses is their investment in innovation and research. While not all companies have the luxury of dedicating huge sums to these pursuits, they can be the difference between exceptional growth and being overtaken by the competition.
Global R&D spending is now almost US$1.7 trillion per year, with 80% of that coming from just 10 countries. (UNESCO)
The United States sees the highest proportion of investment in research and development coming from its business sector. 71.5% of American R&D spending comes from businesses. (UNESCO)
In Germany that number is 67.7%, in France it’s 63.6%, and in the U.K. 65.1%. These countries are all in top 8 for total R&D spending in the world, with the majority of that spending coming from businesses. (UNESCO)
R&D costs have dramatically overtaken advertising spending for the world’s largest brands. (HBR)
Amazon spends far more on research and development than any other company. The amount spent surpassed US$22.5 billion in 2018, $6bn USD more than second placed Alphabet. (Strategy&)
Countries in the European Union spent more than €320 million on R&D in 2017 - 2.07% of total GDP. (ec.europa.eu)
Business spend matters
As we've seen, companies spend huge amounts on everything from marketing to taxes. New tools are emerging, businesses are investing more in office perks, and travel is growing quickly too.
But managing all this spending is still a challenge. And that's what we're here to fix.
If you'd like to learn how to give your team more flexibility and freedom, while also gaining more visibility and control over your spending, talk to us:
Curious how Spendesk works?
Try an interactive demo to see spend control and approvals end-to-end.
Get a free tour)

)
)
)
)
)